 teamchong
514a4f0b74
teamchong
514a4f0b74
- applicability: isPxpipeSupportedModel reads PXPIPE_MODELS (comma-sep,
  default claude-fable-5 only) and strips bracket/variant tags like [1m];
  Opus becomes opt-in with no code change. Default behavior unchanged.
- FINDINGS: Opus 4.8 re-test - arithmetic 98/100 (-2pp), verbatim 6/15
  (was 93/100, 0/15): improved but still taxed -> default stays Fable-only.
- FINDINGS + eval/glyph-matrix/sweep: root cause of the read tax is per-glyph
  RESOLUTION, not font shape (confusions scale with px and vanish by 10x16).
  Opus needs ~4x glyph area to read reliably; the 1568px ceiling makes that
  break-even, so there is no profitable Opus operating point.
pxpipe
Cut Claude Code input-token spend by rendering bulky context as images.
Anthropic bills a 1568px-wide image at a flat rate regardless of how much text is inside it. Dense content (code, JSON, tool output) packs ~3.1 chars per image-token vs ~1 char per text-token on real Claude Code traffic. pxpipe is a local proxy that exploits that gap: it rewrites the bulky parts of your request (system prompt, tool docs, older history) into compact PNGs before the request leaves your machine.
Savings are workload-dependent — pxpipe wins on token-dense content and
leaves sparse/small requests untouched — so this is a measured snapshot, not a
constant. Across production traces the end-to-end bill drops ~59–70%
(~72–74% on the requests it actually compresses), with full dollar math:
input + cache writes at 1.25× + cache reads at 0.1× + output at 5×, every
request measured against its own count_tokens counterfactual. Two snapshots: a
13,709-request log turned $100 into ~$41 (59% end-to-end; ~$28 / 72% on the
7,756 it compressed); a later 8,904-compressed-request trace measured ~70%
end-to-end / ~74% compressed. Reproduce it on your own traffic from
~/.pxpipe/events.jsonl.
This is what the model sees instead of text:
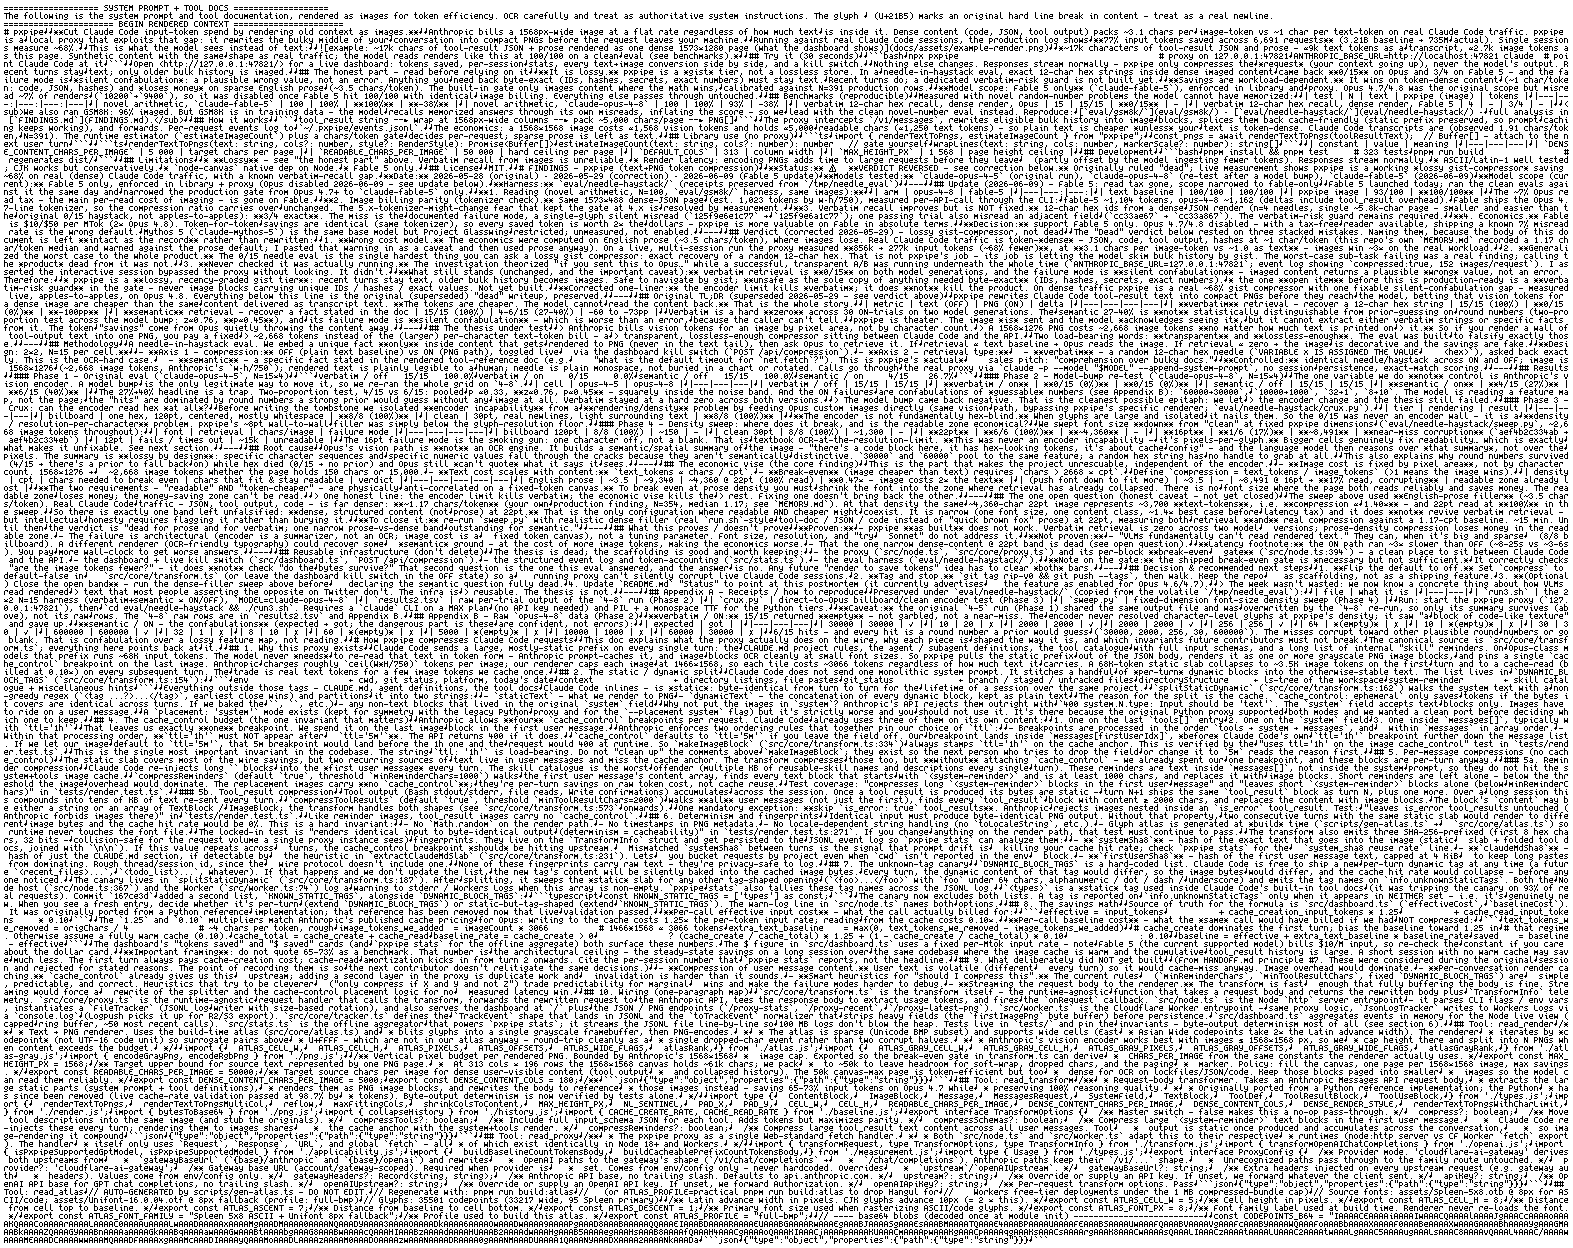
~48k characters of system prompt + tool docs (this repo's own README,
FINDINGS, and source), ≈25k tokens as text, ≈2.7k image tokens as this page.
Produced by the real transformRequest pipeline: whitespace-minified, reflowed
into full rows with ↵ marking original newlines, OCR instruction banner
co-rendered on top. The model reads renders like this at 100/100 on a clean
eval (see benchmarks).
Try it (30 seconds)
npx pxpipe-proxy                                  # proxy on 127.0.0.1:47821
ANTHROPIC_BASE_URL=http://localhost:47821 claude  # point Claude Code at it
Open http://127.0.0.1:47821/ for a live dashboard: tokens saved, per-session stats, every text→image conversion side by side, and a kill switch.
Nothing else changes. Responses stream normally; pxpipe only compresses the request (your context going up), never the model's output. Recent turns stay text; the system prompt, tool docs, and older bulk history are imaged.
The honest part, read before relying on it
It is lossy. pxpipe is a gist tier, not a lossless store. In a needle-in-haystack eval, exact 12-char hex strings inside dense imaged content came back 0/15 on Opus and 13/15 on Fable 5, and the failure mode is silent confabulation: a plausible wrong value, not an error. Anything you need back byte-exact (IDs, hashes, secrets, exact numbers) must stay text. Recent turns do; a dedicated verbatim-risk guard is not built yet.
Does it break real work? Parity in what we measured: a 10-instance SWE-bench Lite pilot (the easy subset) resolved 10/10 on both arms, pxpipe ON at $27 vs OFF at $54 token-equivalent, and 19 SWE-bench Pro pairs (harder, long-horizon) resolved 14/19 ON vs 15/19 OFF at -60% per-request: verdicts agree on 18/19, and the single split (one ON fail) re-resolved 3/3 when replicated, i.e. run-to-run agentic variance, not compression. Small n, details and caveats below.
Savings are workload-dependent. It wins on token-dense content (~1 char/token: code, JSON, hashes) and loses money on sparse English prose (~3.5 chars/token). The built-in gate only images content where the math wins, calibrated against N=391 production rows.
Model scope: Fable 5 only (claude-fable-5), enforced in library and
proxy. Opus 4.7/4.8 was the original scope but misread ~7% of renders
(10200→9400), so it was disabled once Fable 5 hit 100/100 with identical
image billing. Everything else passes through untouched.
Benchmarks (reproducible)
Measured with novel random-number problems the model cannot have memorized:
| test | N | text | pxpipe (image) | tokens |
|---|---|---|---|---|
novel arithmetic, claude-fable-5 |
100 | 100% | 100% | −38% |
novel arithmetic, claude-opus-4-8 |
100 | 100% | 93% | −38% |
| gist recall A/B (decisions, values, paths, names, negations; with distractors; 15k-45k char sessions), Fable 5 | 98/arm | 98/98 | 98/98 | - |
| state tracking (value mutated 3x, final/first/count), Fable 5 | 18/arm | 18/18 | 18/18 | - |
| confabulation on never-stated facts (lower is better), Fable 5 | 16/arm | 0/16 | 0/16 | - |
| verbatim 12-char hex recall, dense render, Opus | 15 | 15/15 | 0/15 | - |
| verbatim 12-char hex recall, dense render, Fable 5 | 15 | - | 13/15 | - |
SWE-bench Lite pilot (end-to-end task quality)
10 SWE-bench Lite instances, Claude Code + Fable 5, paired runs through
pxpipe ON vs OFF, graded with the official swebench Docker harness:
| pxpipe ON | OFF | |
|---|---|---|
| resolved | 10/10 | 10/10 |
| request size vs own uncompressed body | −65% | ±0 |
The −65% is per-request (count_tokens probe of each body before
compression), so it has no turn-count confound. n=10/arm, Lite skews easy.
Run totals, receipts, caveats: eval/swe-bench/.
SWE-bench Pro bench (harder, long-horizon)
19 completed pairs across two runs (2 dropped: checkout failed both
arms), same setup, official SWE-bench_Pro-os Docker harness:
| pxpipe ON | OFF | |
|---|---|---|
| resolved | 14/19 | 15/19 |
| request size vs own uncompressed body | −60% | ±0 |
Verdicts agree on 18/19 (three instances failed both arms, one with
byte-identical patches across arms). The single split (navidrome, ON
fail) was replicated 3x on the ON arm: all three runs produced an
identical patch and resolved, so the original loss was run-to-run
agentic variance, not compression. Receipts:
eval/swe-bench-pro/.
We also ran GSM8K: 96% imaged. But GSM8K is in training data, so the model
recalls memorized answers through its own misreads, inflating the score, so we
lead with the clean novel-number eval instead. Reproduce:
eval/gsm8k/ · eval/needle-haystack/ ·
eval/gist-recall/ ·
full analysis in FINDINGS.md.
FAQ
Is the headline end-to-end, or only on the requests you touched? End-to-end, the whole bill. Most compression tools report savings only on the input slice they touched, which flatters the number. The end-to-end denominator is every production request: the small ones pxpipe correctly left untouched, all cache writes and reads, and all output tokens (which the proxy never compresses). On a 13,709-request snapshot that was 59% ($100 → ~$41); a later 8,904-compressed-request trace measured ~70%. Compressed-only runs higher (~72–74%) and is quoted separately, never as the headline. The exact figure is workload-dependent — reproduce it on your own log.
How is the math measured?
Both sides of the same request, at the same moment. For every /v1/messages
POST the proxy fires a free count_tokens probe on the original uncompressed
body (the counterfactual) in parallel with the real forward, and reads
Anthropic's actually-billed usage block off the response. Both land in the
same row of ~/.pxpipe/events.jsonl, so there is no turn-count or
run-to-run confound. Dollar conversion uses Fable 5 list ratios: input ×1.0,
cache write ×1.25, cache read ×0.1, output ×5. Cache pricing is applied
identically to both sides, so the caching discount cancels and cannot be
double-counted as "savings". Re-derive it yourself from the events log: the
formula and field names are documented in src/core/baseline.ts.
What does it actually compress? Three kinds of input blocks, each behind a profitability gate:
- large
tool_resultbodies (file reads, command output, logs) above ~6k chars of token-dense content - older collapsed history: turns behind the live tail get re-rendered as image pages, recent turns always stay text
- the static system prompt + tool docs slab
Everything else passes through byte-identical: your messages, recent turns, the model's output (it is the response, the proxy never touches it), sparse prose, and anything too small to win. Non-Fable models pass through entirely.
Has it ever failed for real, outside the benchmarks? Yes, once in weeks of daily use: the model recalled a person's name from imaged chat history and got it confidently wrong. No error, just a plausible wrong name. That is the documented failure mode: exact strings in imaged content are not byte-safe. Coding sessions tolerate this because the agent re-reads files before editing; pure chat recall has no such check.
How it works
tool_result string ──► wrap at 1568px-wide columns ──► pack ~5,000 chars/page ──► PNG[]
The proxy intercepts /v1/messages, rewrites eligible bulk history into image
blocks, splices them back cache-friendly (static prefix preserved, so prompt
caching keeps working), and forwards. Per-request events log to
~/.pxpipe/events.jsonl.
The economics: a 1568×1568 image costs ≈1,568 vision tokens and holds ≈5,000
readable chars (≈1,250 text tokens), so plain text is cheaper unless your
text is token-dense. Claude Code transcripts are (observed 1.91 chars/token,
N=391). The runtime estimator (estimateImageCount) plus a chars/token gate
decides per-request; sparse prose is left as text.
Library use (no proxy)
import { renderTextToPngs, estimateImageCount } from "pxpipe";

const pngs = await renderTextToPngs(toolResultText);  // Buffer[], attach to the next user turn
renderTextToPngs(text: string, cols?: number, style?: RenderStyle): Promise<Buffer[]>
estimateImageCount(text: string, cols?: number): number   // gate yourself
wrapLines(text: string, cols: number, markerScale?: number): string[]
| constant | value | meaning |
|---|---|---|
DENSE_CONTENT_CHARS_PER_IMAGE |
5 000 | target chars per page |
READABLE_CHARS_PER_IMAGE |
50 000 | hard ceiling per page |
DEFAULT_COLS |
313 | column width |
MAX_HEIGHT_PX |
1 568 | page height ceiling |
Development
pnpm install && pnpm test     # 323 tests
pnpm run build                # regenerates dist/
Limitations
- Lossy: see "the honest part" above. Verbatim recall from images is unreliable.
- Render latency: encoding PNGs adds time to large requests before they leave (partly offset by the model ingesting fewer tokens). Responses stream normally.
- ASCII/Latin-1 well tested; CJK works but conservatively.
node-canvasnative dep on Node.- Fable 5 only.
Roadmap
Everything above is measured. Everything here is not. These are hypotheses, not claims; they ship as numbers with an n or they get cut.
- Sharper glyphs. The 13/15 verbatim gap is partly font legibility, not just
the model. A per-char confusion matrix across render styles is paused mid-run
(
eval/glyph-matrix/); if a zero-cost style lowers read error, the gate compresses harder at the same fidelity. - Effective context. Dense text carries at ~3x fewer tokens as images. If that holds in the live window and not just the bill, 1M tokens holds ~2x the real content. Open question: can a task needing ~2M raw context run inside Fable's 1M once the bulk is imaged?
- Less active text, sharper model. Long contexts degrade reasoning as they fill. Imaging old bulk shrinks what the model actively reads while keeping it reachable. Hypothesis: same information, smaller active context, better long-task accuracy.
One bet: longer effective context and a sharper model on long tasks, from the same Fable 5. Numbers or retraction, no hype between.
License
MIT.